
Ask a room of investors how much of their portfolio sits outside the US and most cannot answer. The free Global Portfolio Builder answers it structurally. Here is one real build, run for this post: age 40, $50,000 saved, $12,000 added each year.
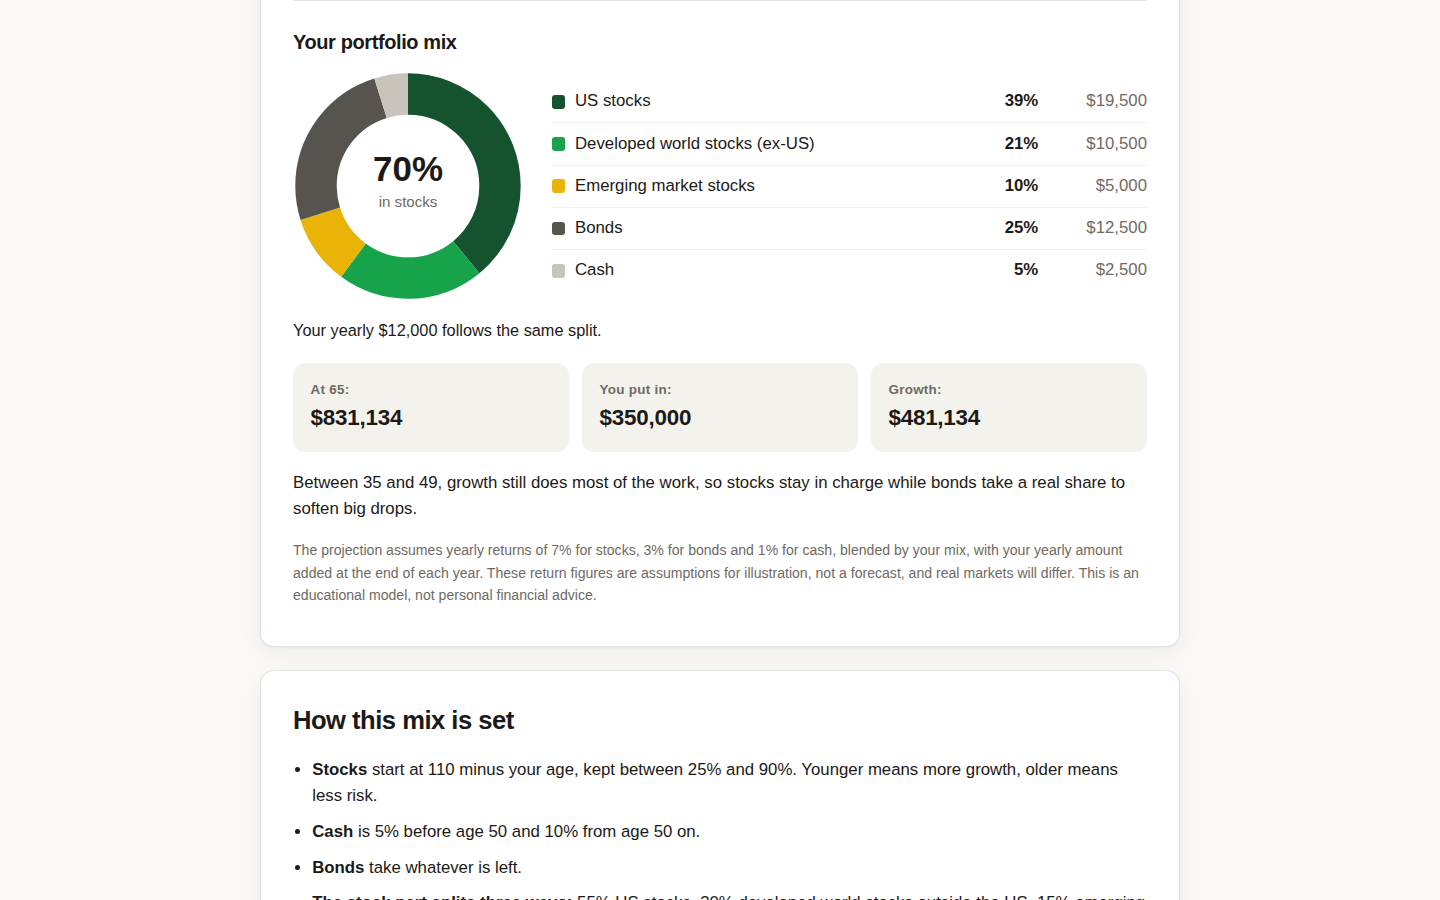
The builder put 70 percent in stocks and split them 39 percent US ($19,500), 21 percent developed world outside the US ($10,500) and 10 percent emerging markets ($5,000), with 25 percent bonds ($12,500) and 5 percent cash ($2,500). Of the stock slice, 31 of the 70 points sit outside the US. At 65 the projection reads $831,134, on $350,000 contributed, so $481,134 of growth, under the tool's stated assumptions of 7 percent a year for stocks, 3 percent for bonds and 1 percent for cash. The tool calls itself an educational model, not personal financial advice, and this post treats it the same way.
1. Start from the map, not the home market
This site exists because the US is the largest market, not the only one; global market cap by country is the picture the builder is simplifying. A 55/30/15 stock split is a deliberate step down from full market weight for the US, not a bet against it.
2. Let age set the stock share
110 minus age gave this build 70 percent stocks at 40. Run the same savings at 55 and the share drops, bonds rise, and the projection calms down. The rule is crude and that is the point: it forces the conversation most people skip.
3. Give bonds and cash a stated job
Here bonds are a quarter of the portfolio and cash a twentieth, there to soften drops and fund near-term plans, as the 25 year emerging markets comparison shows they periodically must.
4. Read the projection as an assumption with a number attached
$831,134 is not a forecast. It is the stated return assumptions, compounded. Change nothing but the yearly amount and watch the growth tile move more than any allocation tweak moves it; contributions beat cleverness at this scale.
5. Compare a second scenario before you commit
Two builds a day are free, which is exactly enough for a now-versus-later pair: retire the mix at your real age, then at five years older, and look at what waiting costs. For the market-level cross-check, the Tickers for the Tickerless charts the private side of the US market, and the Insider Sentiment Gauge shows what company insiders are doing inside it. New to the builder? The short explainer covers the rules first, then run your own numbers in the Global Portfolio Builder.