
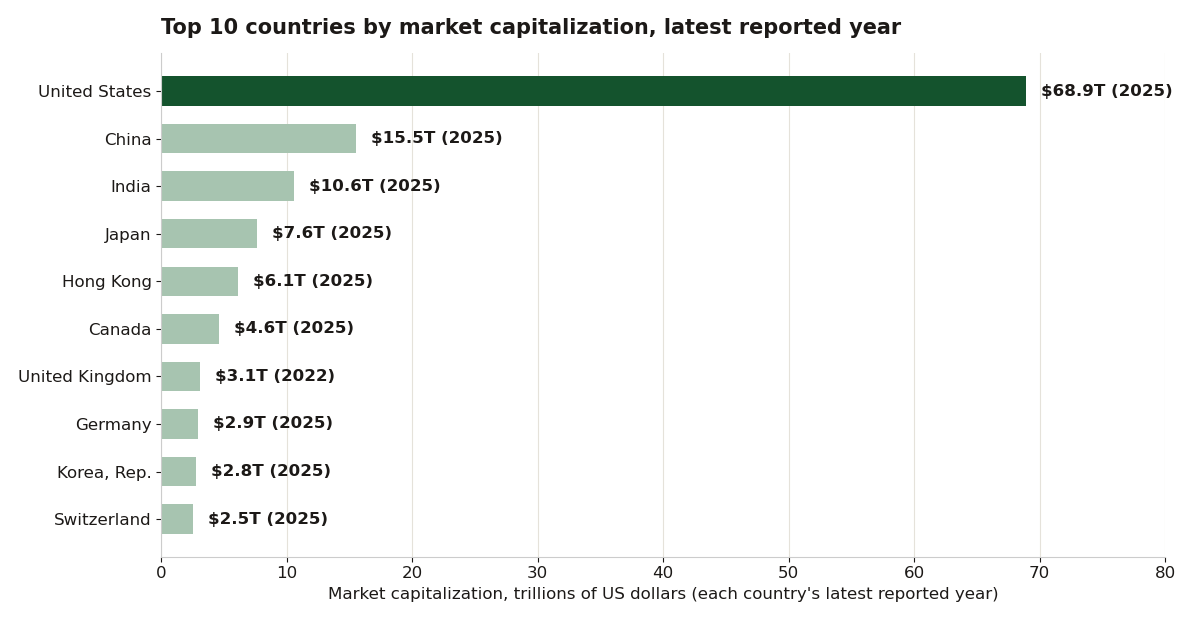
Most market-cap rankings count countries. The ranking that wins this site's head query counts companies first. CompaniesMarketCap's all-countries page, checked on October 31, 2026, puts the world stock market at $149.165 trillion, built up from 11,396 companies across 52 countries and regions. The United States accounts for $79.052 trillion of it, spread over 3,655 companies. China is second at $10.630 trillion across 498 counted companies, Japan third at $7.718 trillion across 944, then the United Kingdom at $4.599 trillion and Canada at $4.200 trillion.
The average hiding inside the total
Divide value by companies and the ranking changes character. The directory's own arithmetic gives an average counted company of about $21.6 billion in the US and, strikingly, about $21.3 billion in China: nearly the same average size, reached with a seventh of the company count. Japan's average is about $8.2 billion across almost twice China's count. Read carefully, those are statements about the directory's coverage as much as about the markets: a company-by-company census counts the giants completely and the small caps partially, and China's giants are very giant. But the shape is real either way. The American market is deep as well as big; the Chinese total is concentrated at the top.
Why this site keeps its own count
Our database here takes the other road: World Bank WDI series, 2,098 country-year records, annual and lagged, built for history rather than for today's tick. The two approaches answer different questions. The company census tells you what the market is worth this week and who carries the weight. The annual series tells you how the ranking moved over twenty years, which is the question behind most of this site's charts, and the input the Global Portfolio Builder uses when it splits a portfolio between the US and the rest of the world.
How to read the $149 trillion
As a snapshot with a method attached, not as a constant. The page itself notes prices are delayed by minutes to hours, and a company census reprices with every session. When the number moves, ask which part moved: the giants, the count, or the currency. The ranking will not tell you. The method will.